 |
| Market Street Corridor and Union Square - 1930 |

The Cube Cities Blog
29 June 2013
San Francisco Growth Animation (1877-2015)
28 June 2013
Calgary Growth Animation (1892-2016)
This video shows Calgary's skyline being gradually built over an extended time span from 1892 onwards. Only buildings that currently exist are shown. The color styling can represent any building or market variable from the Cube Cities database.
Another way to learn about a cities development pattern is to use a series of time-lapsed visualizations, highlighting existing buildings, built by year indicated. This provides a better idea of the age of a cities current building inventory. The graphics below tell the story of the construction boom in Calgary from the mid-1970s to the early 1980s. Its easy to recognize that the vast majority of all buildings downtown Calgary were built after 1970.
Green indicates buildings built by the year indicated.
 |
| 1950 |
 |
| 1955 |
 |
| 1960 |
 |
| 1965 |
 |
| 1970 |
 |
| 1975 |
 |
| 1980 |
 |
| 1985 |
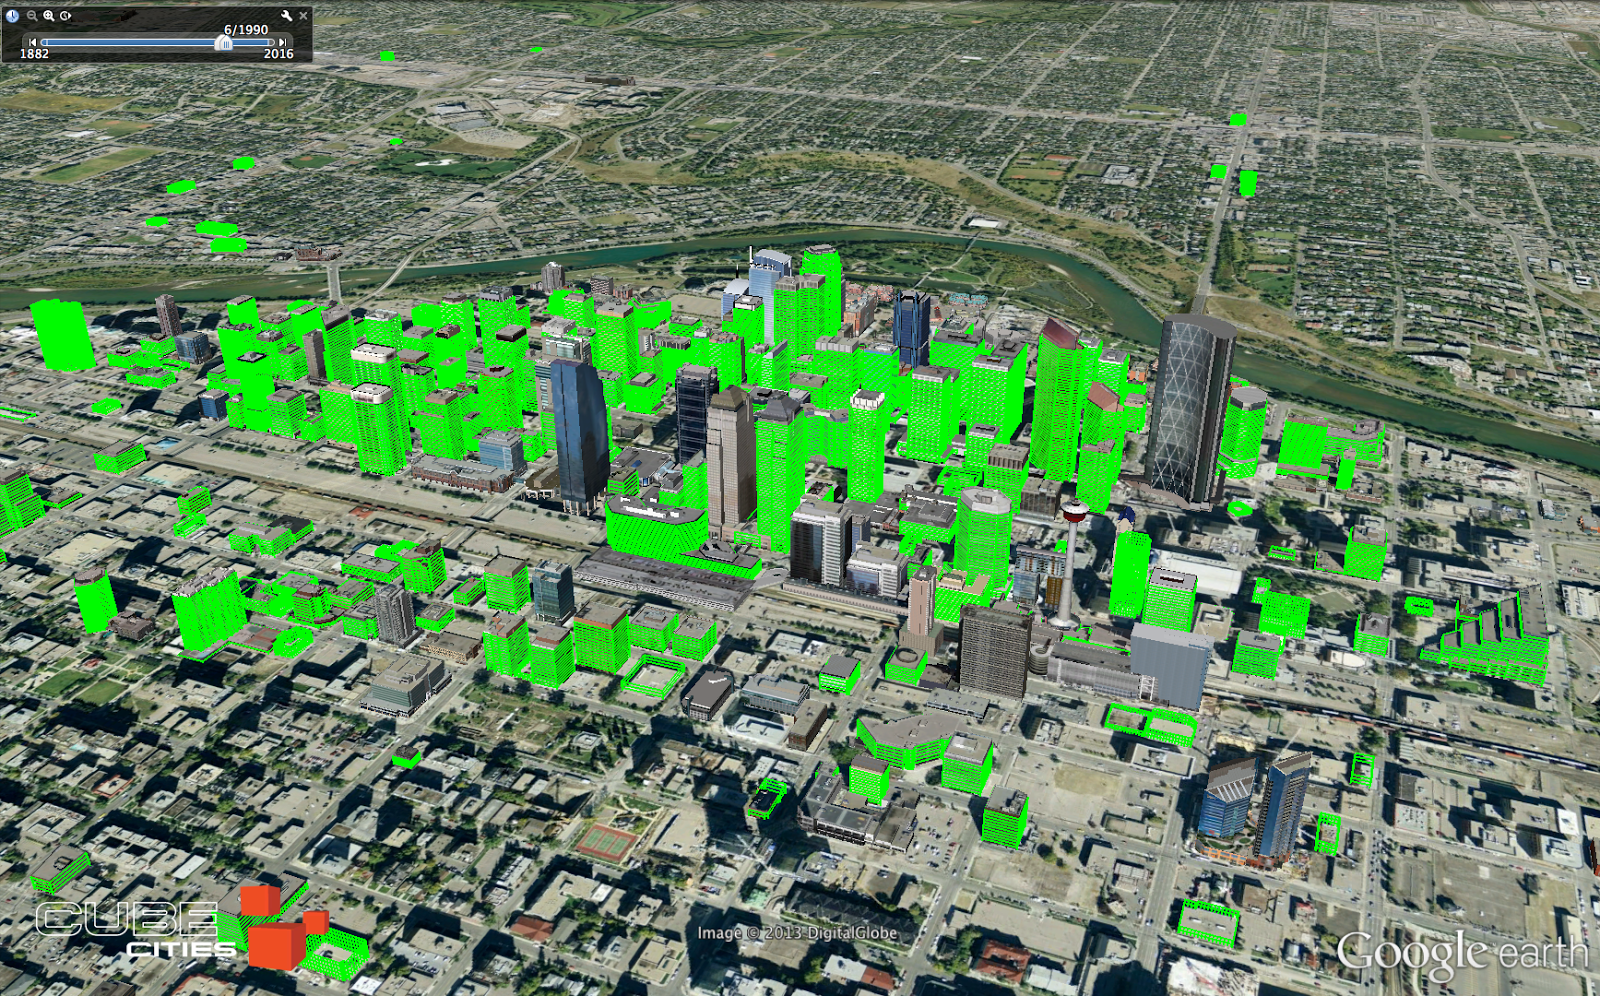 |
| 1990 |
27 June 2013
Chicago Growth Animation (1862-2014)
Here's a visualization of the existing building inventory downtown Chicago with an animation showing each building appear by the year of construction. This is an effective technique for understanding the progression of city development.
Fullscreen, high resolution link
Cube Cities can produce these visualizations for any major city in North America. Contact us to see other markets.
 |
| Chicago Skyline - 1933 |
 |
| Chicago Skyline - 1966 |
20 June 2013
The Story of MPG Office Trust's Los Angeles Buildings
 |
| U.S. Bank Tower, Downtown Los Angeles |
 |
| Vacancy in MPG Office Trust buildings Downtown Los Angeles |
Visit www.cubecities.com to examine all available office space in these buildings, including floor plans and specific leasing details. Data source: www.mpgoffice.com.
30 May 2013
Cube Cities Vis Quiz: Mystery Business District
Use the poll on the right to participate in this vis quiz:
 |
| Where is this Major Business District? |
 |
| Floor 31 in a Mystery Building in a Mystery Business District |
Is it Frankfurt? London? Denver? Paris? Minneapolis? Cast your vote with the poll on the right side of the page. The answer will be revealed on June 3rd at 12pm MST.
ANSWER: Canary Wharf
29 May 2013
NEW! Rich Building Information Now Available
 |
| Find property data with the new Building Information option (click to expand) |
Fullscreen, high resolution link
Keep watching the building information windows, we'll be adding new property data soon. Sign up with Cube Cities to explore this new data source.
Keep watching the building information windows, we'll be adding new property data soon. Sign up with Cube Cities to explore this new data source.
 |
| Building Information covering Downtown San Francisco (click to expand) |
23 May 2013
Uptown Charlotte's Largest Blocks of Office Space: Charlotte Business Journal
 |
| Cube Cities + Charlotte Business Journal Website Slideshow |
Here's a video featuring every available space:
Fullscreen, high resolution link.
It's easy for Cube Cities users to produce videos like the one above for any large city in North America. Sign up on our website to create your own flight of available office space options.
It's easy for Cube Cities users to produce videos like the one above for any large city in North America. Sign up on our website to create your own flight of available office space options.
 |
| Uptown Charlotte's 7 largest blocks of office space (click to expand) |
11 May 2013
CBRE Office Market Snapshot: Sydney City Core
 |
| Sydney's City Core showing available CBRE office space, Governor Philip Tower highlighted (click to expand) |
Here's a look at CBRE's available office space in Sydney's city core, as of May 11th 2013. Missing 3D buildings are illustrated with our versatile Cube Cities visualization platform.
 |
| Space highlighted in 120 Sussex Street |
Fullscreen, high resolution link
8 May 2013
Brookfield Office Properties in 3D: Manhattan
Here's an example of the traditional presentation format for commercial real estate data:
Fullscreen, high resolution link
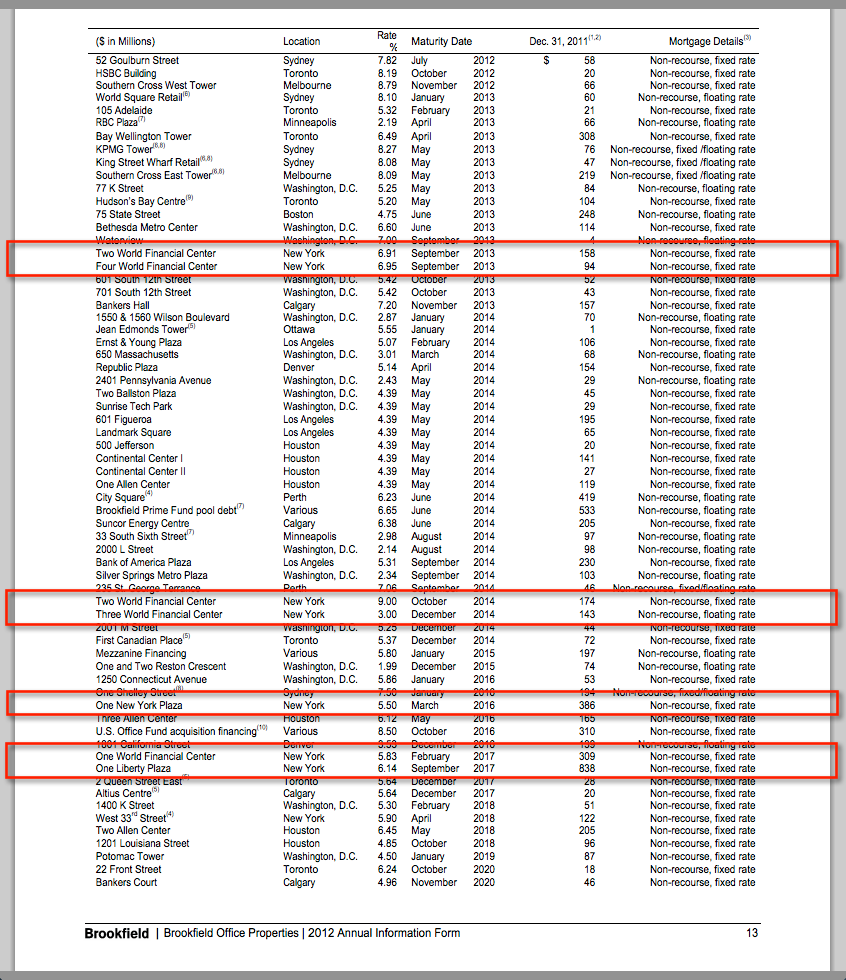 |
| Brookfield Office Properties, Mortgage Information Sheet |
Examining buildings with Cube Cities makes more sense. Our visualizations are the high bandwidth means of understanding building data and the stories behind land economics. Here's a look at the Brookfield Office Properties portfolio in Manhattan, including the current space availabilities in every building.
 |
| Brookfield's 10 major commercial properties in Manhattan |
 |
| Brookfield Place: 8 million square feet |
 |
| The Grace Building: 1.6 million square feet |
All buildings visualized in this video:
Fullscreen, high resolution link
Brookfield Office Properties in 3D: Downtown Toronto
 |
| Downtown Toronto buildings owned by Brookfield Office Properties showing available office space |
 |
| Available space in First Canadian Place |
Fullscreen, high resolution link
Contact us for portfolio visualizations of other large commercial real estate companies in Canada and the United States and see how they compare to the market.
Subscribe to:
Comments (Atom)