Apple received planning approval from the City of Cupertino on October 15th to proceed with the Apple Campus 2 project. The Development Permit allows for the demolition of approximately 2.7 m sqft of existing commercial buildings. It allows for the construction of 3.42 m sqft of office, research, and development buildings; 120,000 sqft (1,000 seat) corporate auditorium, 100,000 sqft corporate fitness center, 25,000 sqft of Valet Parking Reception and 92,000 sqft of utility plants; and associated parking facilities and ancillary buildings.
Here's a visualization of the Development Permit and the buildings that will be removed to make way for the new headquarters.
Cube Cities can instantly convert a property rent roll from Excel to a 3D visualization in Google Earth. Below is a screenshot of what this looks like with sample data from a building in downtown Toronto:
Rent Roll Colourized by Lease Expiry
Here's a movie of what this interface looks like when navigating through downtown Toronto in Cube Cities:
The Cube Cities platform produces many different types of building information styles. Here's a very quick video that shows a brief look at 23 unique styles. These are configurations of our polygons and lines that are stable together and can be used to mimic building activity.
See how cities have historically developed with the Cube Cities Timeline. It lets you play city growth animations using building data for major North American cities.
This is a city growth animation of the buildout of Lower Manhattan from 1840-2020. This movie shows the buildings that exist today that have been built since 1840. This is a floor-level visualization that shows floors appearing as the years pass and eventually begin to cover the southernmost part of Manhattan Island.
The 1920's was a busy decade in the history of Manhattan's development. The 1940's and 1950's were comparatively slow, but development leaped forward again in the 1970's only to slow significantly in the 1990s. In the video above, the pace of growth in Midtown Manhattan can be seen over 165 years at the intersection of Central Park South and Fifth Avenue. As with our previous growth animations, this visualization shows all currently existing buildings by the year they were built.
We can understand the large volume of commercial property that was built in Toronto during the 1970s with this time-lapse visualization of Toronto's financial core. Beginning in 1834, this visual, like our previous time-lapse animations, shows existing commercial and residential buildings appear by year built. Real estate professionals often use stories of past economic expansion and contraction when explaining office markets, with market visualizations from Cube Cities those stories become illustrated and the true economic realities of the past become evident and understood.
Below is a sequence of visuals that shows existing buildings downtown Toronto built by the year indicated. The vast expansion of space downtown from the 1960s to 1980 is apparent.
Click any image to expand.
1910
1920
1960
1970
1980
Contact us to see different styles of time-lapse urban visualizations, they help people understand change in commercial and residential real estate markets.
Here's a view of the historic development near San Francisco's Market Street and Union Square districts over the past 138 years. Buildings that remain today appear as the time-lapse plays. This visualization also shows white wireframes that represent the urban density that is eventually built on the surrounding properties.
This video shows Calgary's skyline being gradually built over an extended time span from 1892 onwards. Only buildings that currently exist are shown. The color styling can represent any building or market variable from the Cube Cities database.
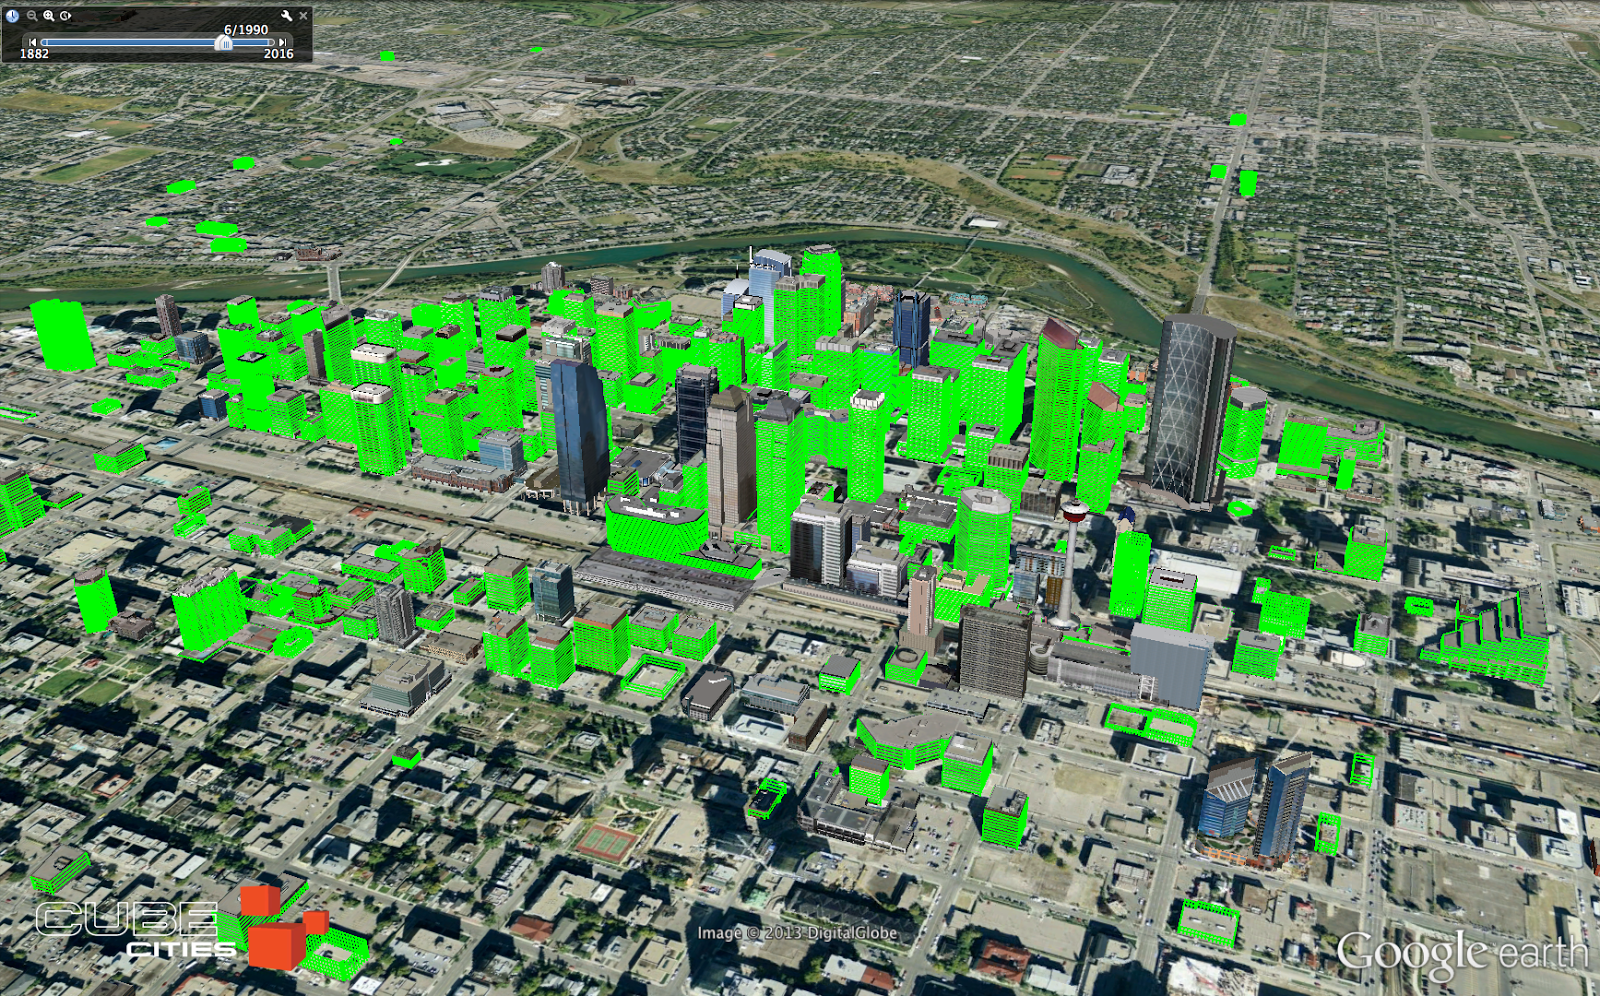
Another way to learn about a cities development pattern is to use a series of time-lapsed visualizations, highlighting existing buildings, built by year indicated. This provides a better idea of the age of a cities current building inventory. The graphics below tell the story of the construction boom in Calgary from the mid-1970s to the early 1980s. Its easy to recognize that the vast majority of all buildings downtown Calgary were built after 1970.
Green indicates buildings built by the year indicated.
1950
1955
1960
1965
1970
1975
1980
1985
1990
Cube Cities produces these visualizations for any major city in North America. Contact us to see visualizations of other markets.
Here's a visualization of the existing building inventory downtown Chicago with an animation showing each building appear by the year of construction. This is an effective technique for understanding the progression of city development.