Cube Cities Blog

The Cube Cities Blog

18 December 2017

SketchUp Blog: Thinking Outside the Box with Cube Cities

Trimble's Philip Grigsby recently published an extensive article about Cube Cities on the SketchUp Blog. Here's a link to his article: 


SketchUp is an important part of the process to create customized, high quality 3D building models. The potential to stream SketchUp-created glTF models using Cesium is very exciting.


18 November 2017

Available Space in Canada's Greenest Buildings


Here are several visualizations of currently available office and retail space in the largest Canadian cities. This space is within downtown buildings that meet criteria from both the Canada Green Building Council's LEED and BOMA Canada's BOMA BEST (Building Environmental Standards) designation.

Click on any graphic to expand the image or view these cities in 3D here and explore the data with other search filters. 

Property data from Altus Data Solutions.

Toronto

Montreal

Vancouver

Calgary

Ottawa

2 November 2017

Cube Cities @ Calgary Real Estate Forum

(L-R) J. Cuff, S. Kanungo, H. Kolias, J. Gondek
Last week we had the pleasure of participating on a panel about disruptive technology at the Calgary Real Estate Forum. James Cuff, our CTO at Cube Cities, was joined by Hugh Kolias, founder of YuHu Inc and Shawn Kanungo, Sr. Manager of Strategy at Deloitte. The panel was moderated by Jyoti Gondek, recently minted City of Calgary Councillor for Ward 3. Here's a summary of what was discussed.

(J. Cuff)

Question 1: Describe your big picture perspective of technology and its ability to be a disruptor.

The conversation here focused on the fact that technology will be disruptive if your organization does not take an active role in identifying where technology is driving your industry. Additionally, most often truly disruptive technology will come from outside the industry it disrupts. To remain valid in these situations organizations need to be open to this disruption and adopt disruptive practices quickly. 

Question 2: How does technology impact the real estate sector?

We started the conversation here with the background that most people now conduct a significant amount of their work connected via smartphones. The real estate sector has been slow to migrate to a mobile workforce. Additionally, as organizations change and become more distributed and fluid the requirements for space also changes. Organizations will be structured much differently in the next 5 years and real estate needs to adapt to that change  (flex space, coworking, etc.). We touched on the changes that democratization of data will bring to the RE industry but didn't dive deep into that given that it's a threat to a number of existing roles.  

Question 3: What impacts do you think technology will have on user experiences in real estate?

This question also took the conversation into how technology is enabling a mobile workforce, and the user experience around office space and working will be changed via that increasing mobility. We also quickly discussed what may occur with a significant number of self-driving vehicles, extending the commute reach and functional office hours of workers.Touched on the changes to retail space with the steady increase in online purchasing, will retail become pickup and only sample examination with no stock carried in store (Nordstroms in Seattle is already doing this). 

Question 4: What’s the most innovative example of technological disruption you have seen in action, and how does it impact real estate?

We did not get to answer this question directly as we ran out of time. The audience was fully engaged and were asking questions throughout the presentation. 


1 November 2017

Our Latest 3D Search App for Altus Data Solutions is Now Live!


Our latest 3D search application for commercial real estate in Canada is now live on the AltusInSite.com website! This new app is a simplified version of our previous 3D search tool, takes greater advantage of the capabilities of CesiumJS and our floor-level building data to make it easy to create meaningful communication graphics for Canada's largest property markets.

With our new 3D search app you can see exactly where space is located in a building and contact the representative to learn more. Altus InSite subscribers can use the app to login to Altus InSite's Building Details Page and learn even more information about the building and the available space such as floor plans, asking rates and operating costs.


The new app allows you to filter space by:

  • Size of available area
  • The date space was added to the market
  • The year a building was built 
  • Building class
  • Associated brokerage 
  • Property manager
  • BOMA Best or LEED building designation
  • Direct or Sublease space
  • Office or Retail space
Use these links to open the app to a specific city:

Please give us your thoughts using the Feedback button on the Main Menu of the app, or contact us. 

15 October 2017

Who Has The Most Available Commercial Space Downtown Calgary?

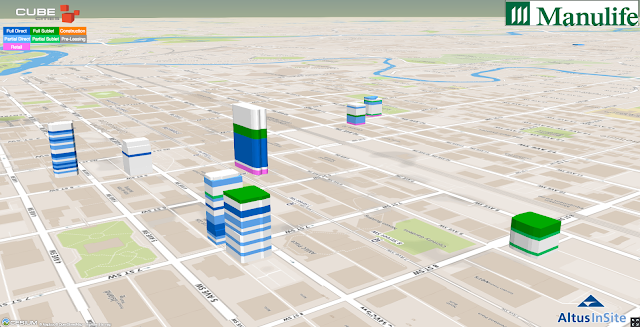
According to the Conference Board of Canada, downtown Calgary currently has a vacancy rate of 27%. Here are data visualizations from our 3D real estate search app that show all available office and retail space from six of the largest property managers in the city. These visualization show only the buildings in their portfolios that have available space.

Use our search app to compare and analyze property managers and REIT's across Canada's largest cities. Live data is provided from Altus Data Solutions.

Find our latest 3D real estate search app here or click any of the links below to explore these portfolio availabilities.


Brookfield Properties

QuadReal

Manulife
Oxford Properties

GWL Realty Advisors

17 September 2017

FDNY Companies & Risk Mapping in 3D

Areas served by NYFD companies across Midtown Manhattan
We can visualize buildings served by their FDNY company in New York with our 3D visualization app for NYC Open Data. The graphic above shows the FDNY coverage across buildings in midtown. This data comes from the NYC PLUTO data set compiled by the City of New York Department of Finance.

Perimeter dangers from a fire at Rockefeller Center
Risk mapping in dense urban areas is best understood in 3D. Here's a look at an example emergency situation at Rockefeller Center with the risk that buildings are exposed to visualized within 100, 500 and 1000 meters. These applications of geospatial heat mapping can be applied to fire, crime or natural disasters such as flooding. The graphic below shows the floor-level interpretation of the same example emergency.


Floor-level emergency data at 30 Rock

24 August 2017

Cube Cities Hotels: Matterport + Expedia = Exposed

Four Seasons Hotel, 52nd Floor Penthouse Suite 
Isn't this the way hotel rooms in dense cities should be searched for and booked? Cube Cities can visualize available rooms from Expedia, position them in 3D and link the room to Matterport virtual tours so its easy to know exactly where in a hotel your room is booked. Now you'll know before you arrive that your view will be the brick wall of the neighbouring property. Watch the video to see a profile of the penthouse suite in the Four Seasons Hotel on 57th Street.

21 August 2017

Trump Tower's Missing Floors

Trump Tower Floor Use
Fifth Avenue's 58-story Trump Tower is made up of 5 retail floors, 14 office floors and 39 floors of residential units. The top three floors of the building are combined into a single penthouse suite, historically occupied by the Trump family. These penthouse floors are numbered 66, 67 and 68, however, because the building directory skips floors 6-13. The developer (Donald J. Trump) claimed the high ceilings of the public atrium justified higher floor numbering of the residential floors. And so, the residential floors are numbered 30 and above. The city’s Buildings Department allows this practice as long as the floors are counted accurately in the building’s certificate of occupancy.

According to New York City's Department of Finance, Trump Tower was completed in 1983, has a building area of 626,000 sqft and is tax assessed at $181.7M. Trump Tower is owned by GMAC COMMERCIAL MORTG.

The graphic below illustrates the tower amongst notable skyscrapers in Manhattan's Plaza District. This is a screenshot taken from our NYC OpenData 3D visualization app which reveals property data for every building in New York City.

Trump Tower in the Midtown Skyline


13 August 2017

Explore NYC OpenData in Cube Cities with the iPad Pro


888 Seventh Avenue in Cube Cities with NYC PLUTO data (click to expand)

The City of New York maintains the largest and most accessible open building data in the world. Cube Cities uses this data to power a new application that allows users to visualize NYC PLUTO data in 3D with the iPad Pro. PLUTO contains tax lot level data from the NYC Department of Finance, providing details on land use, property ownership, assessed values, tax forms and much more, all by leveraging the ecosystem of building information provided for free from New York government departments. Plus, with our floor-level technology the application can show office and residential vacancies, rental rates or any other client-provided data set.

Sign up here to learn more about this unique mobile application for NYC buildings.

599 Lexington in Cube Cities with NYC PLUTO data
Midtown Manhattan 3D buildings joined with PLUTO indicated with red

9 August 2017

3D Apartment Availability at The Eugene in Manhattan West


Here's a look at the interior locations of the remaining 11 apartments for rent at Brookfield's residential project in Manhattan West called The Eugene. This 62 floor residential tower was completed earlier this spring and contains 844 apartments. The Eugene is part of the 6 building,
7 million square foot Manhattan West development by Brookfield Properties. Live demo link.

Watch the iPad-recorded demo below. Contact us to see the live demo and explore availability in other residential buildings in New York.